Probability: The measurement of the likelihood an event will happen.
Observed Probability: A variable that is observed and dictates the outcome.
Theoretical Probability: Or expected probability, an example would be if you throw a penny the probability of getting heads is 1/2 and tails is 1/2.
Conditional Probability: Probability of an event, given that another event has already occurred.
Probability of Multiple Events: The probability of many events can be calculated by multiplying their independent properties together.For example finding the probability of getting heads three times in coin tosses. 1/2 * 1/2 * 1/2 = 1/8
Expected Value:i A predicted value of a variable.
Two-Way Tables:i A table that organizes data about two variables; usually helpful getting data onto paper.
Tree Diagram: A diagram with a structure of branches connecting lines, representing different processes, relationships and outcomes. Another way to get data onto paper to help with calculations
Joint Probability: A statistical measure where the likelihood of two events happening together and at the same point and at the same point in time are calculated. For example, the probability of event Y happening at the same time as event X.
Marginal Probability: The probability of one variable taking a specific value irrespective of the values of the others.
|
|
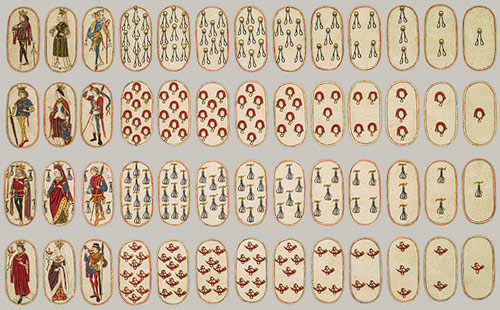
Origin: Bassetta emerged in Renaissance Italy, was later introduced to France, and then slowly found it’s way to England. Beginning of play in Italy was circa 1500 and wasn’t recorded in England until around 1700. Bassetta has potential for huge losses(although there is also a small window for large winnings), France declared an edict that only “sons of great families” could be a talliere. Lower classes were also prevented from gambling more than a certain amount. However, even with the edict in place, several families fell into financial ruin resulting in the games ban by Louis XIV in 1691. today the game has lost its touch, only played in history.
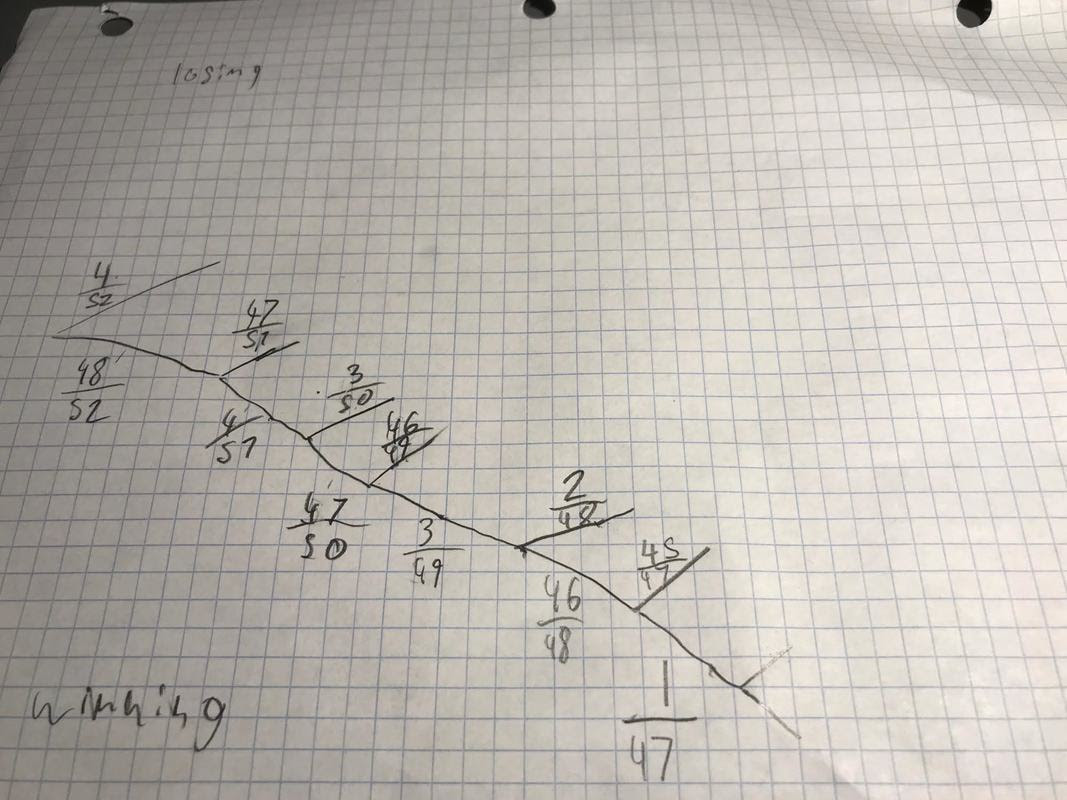
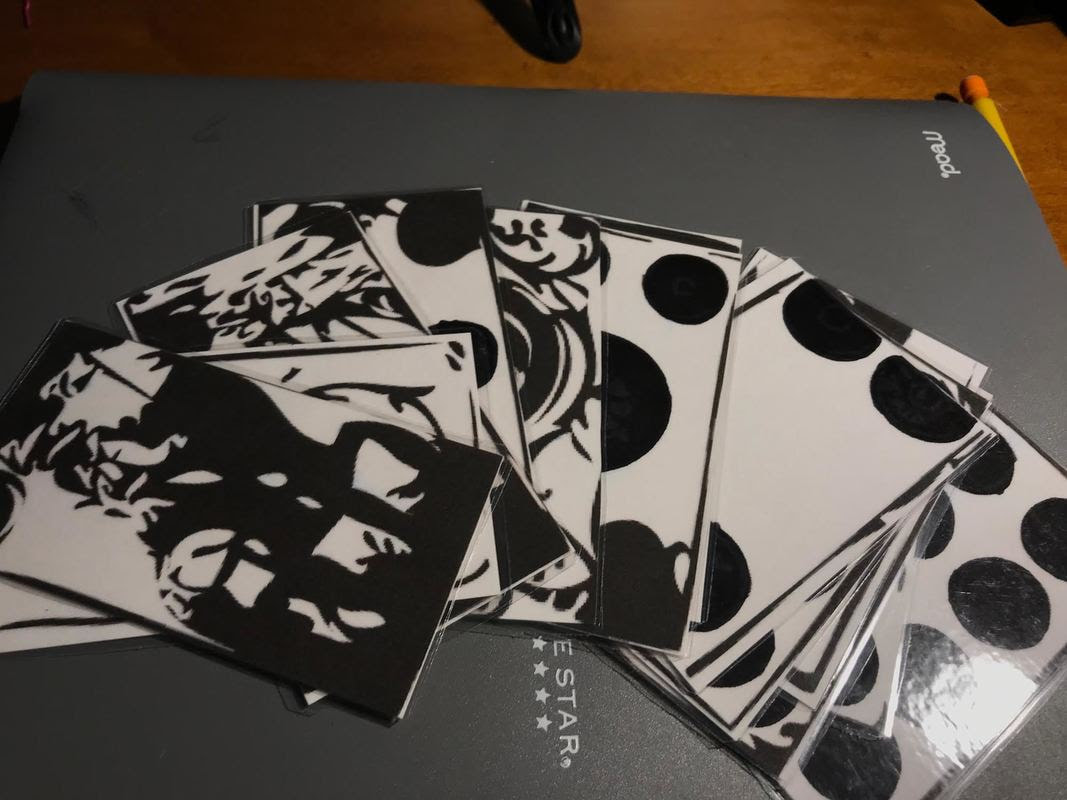
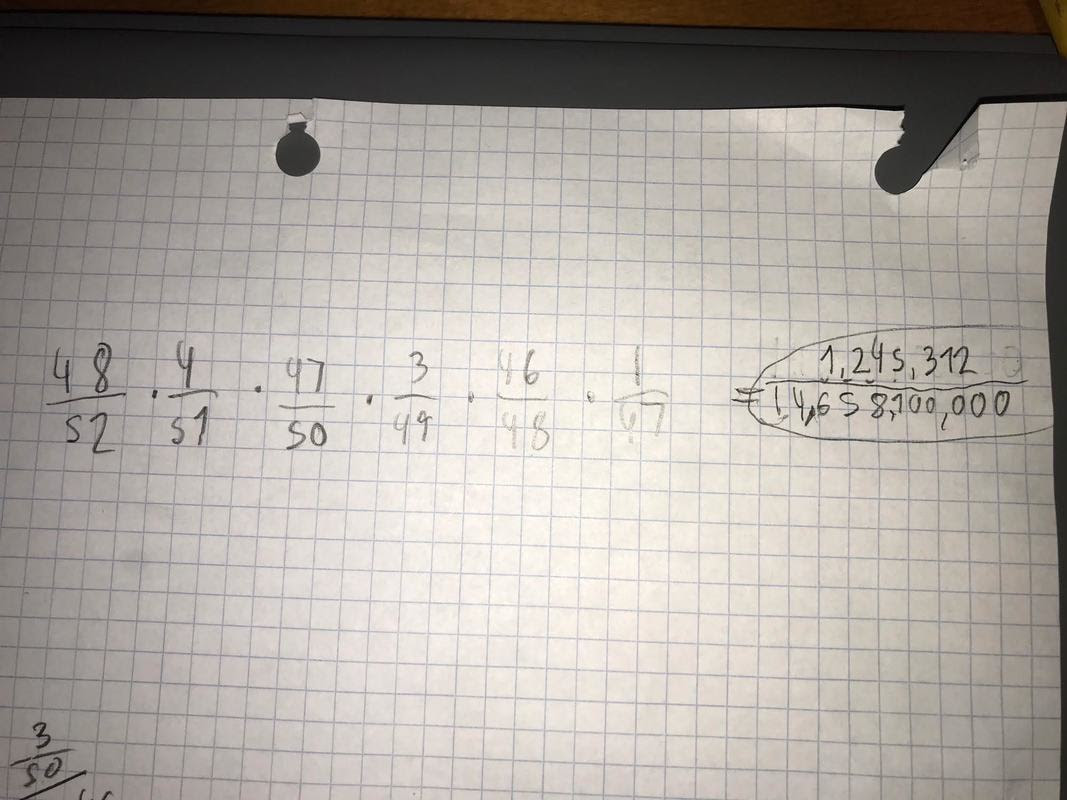
How It is played: I chose this card game mostly because it looked so complicated and outlandish. I wanted to take a challenge in this project because card games interest me. at first I had little ideas how to even breakdown the games instructions, but I showed one aspect of a mathematician by acting out the problem, putting it in front of me. I got two decks of cards and followed the steps while actually playing with my cards and invisible opponents. Enjoy reading about how to actually play Bassetta, I hope you can follow along. To play there’s a dealer (talliere) who gets their own full deck of cards and then depending on how many players (punters) there are, a varying number of additional decks is used (1 deck for 2 to 3 players, 2 decks for 4 to 7, etc), the decks are divided into their suits -13 cards in all- and called a book. The player then decides which of their cards they would like to play and places them face up on the table; bets are made by placing a wager on top of any upturned card and all cards in a book can be bet on with any wager each turn. Once all bets have been made the dealer turns over one card face up from the bottom of their full deck and wins all bets placed on cards that match this one's rank. Then the dealer deals two cards off the top of the deck -first card wins, second card loses- meaning that if the player's card matches the rank of the second card then the dealer takes their wager and that card is out of play for this round, but if the player's card matched the rank of the first card, the dealer pays out a match of the wager on the player's card. From here the player can either retire the card and keep the wager won or leave the card and wager in play skort of like double or nothing. This is called a peroli and the card is marked to signify this (usually the corner is folded). If a card is perolied and i️t loses the dealer takes the original wager and the card is taken out of play, but if i️t wins the wager is paid to the player at 7 times the original wager, this is called winning a Sept & Leva. This can be taken out of play or left in play the same as the first peroli. A player can peroli a card up to 4 times (4 corners). The next peroli is called Quinze & Leva—15 times the initial wager, the third is called Trente & Leva—30 times the initial wager, and the fourth peroli is called Soixante & Leva—60 times the initial wager. If a perolied card loses at any point the player only loses the initial wager. The dealer's final card is a losing card and if a player's card matches its rank the wager goes to the dealer. Probability AnalysisThe photos below show a probability tree (on the Left) and the probability calculations for four perolies(right). Again, perolies are the bets that have won a hand multiple times, but only can win 4 times. That is the maximum amount of times you can win one hand. The table shows one side starting with 4 cards out of 52, and the otherside with 48 cards out of 52. These resemble the 4 cards needed to get 4 wins and the 48 other cards that will need to be drawn during the loosing card from the dealer. |
reflection
I think the experience of this project was good, I think this because it taught us a lot about probability and at the same time we were learning about renaissance which really help out with our world history class. This project had its ups and downs for example it was very challenging to find a game to play because there is so little information about these games on the internet. A success of this project was we got to learn about how the people in the renaissance would entertain themselves and what they would do for fun.
I think the experience of this project was good, I think this because it taught us a lot about probability and at the same time we were learning about renaissance which really help out with our world history class. This project had its ups and downs for example it was very challenging to find a game to play because there is so little information about these games on the internet. A success of this project was we got to learn about how the people in the renaissance would entertain themselves and what they would do for fun.
